记忆盒子
把记忆装进灰色的盒子,封装起来,那年那月,重新拾起。

实例演示C#利用dotnetcharting控件生成柱状图
作者:Kaka 时间:2009-6-7 10:27:34 浏览: 评论:1
由于项目需要画统计图,经讨论,我们选用了dotnetcharting这个控件。dotnetcharting是一款非常棒的生成统计图表的控件,开发人员只需要参考范例,掌握思路,就能够自己自由的编写代码,实现各种各样的统计效果图。正版dotnetcharting是需要购买的,价格目前官方网站上显示是$395,相当的昂贵哦。不过中国人很聪明,现在到处可以下载破解版了。dotnetcharting目前已经支持.net Framework 2.0, 3.0, and 3.5了,有c#和vb.net版本。相当的不错!
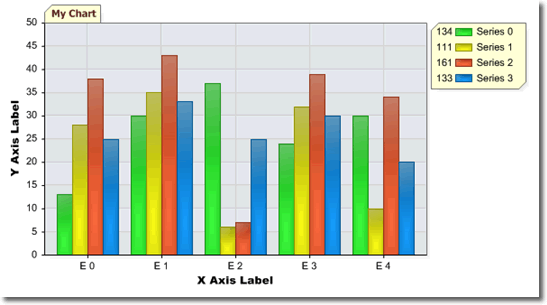
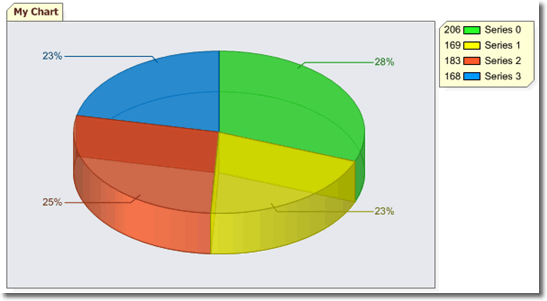
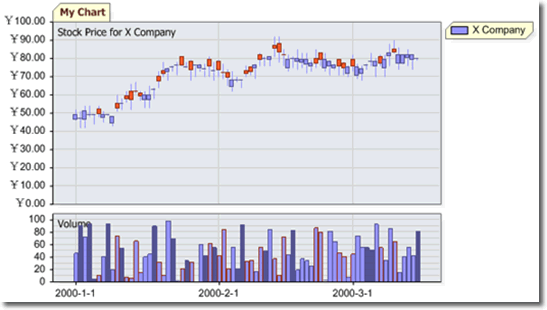
下面是几个截图,看看效果如何?

(图1) 2D柱状图

(图2) 3D饼状图

(图3) 股票走势图
dotnetcharting还能作出各种各样的图表出来,在此就不一一罗列了。现附上(图1)的代码:
C#
<%@ Page Language="C#" Description="dotnetCHARTING Component"%>
<%@ Register TagPrefix="dotnet" Namespace="dotnetCHARTING" Assembly="dotnetCHARTING"%>
<%@ Import Namespace="System.Drawing" %>
<script runat="server">
SeriesCollection getRandomData()
{
SeriesCollection SC = new SeriesCollection();
Random myR = new Random();
for(int a = 0; a < 4; a++)
{
Series s = new Series();
s.Name = "Series " + a;
for(int b = 0; b < 5; b++)
{
Element e = new Element();
e.Name = "E " + b;
e.YValue = myR.Next(50);
s.Elements.Add(e);
}
SC.Add(s);
}
// Set Different Colors for our Series
SC[0].DefaultElement.Color = Color.FromArgb(49,255,49);
SC[1].DefaultElement.Color = Color.FromArgb(255,255,0);
SC[2].DefaultElement.Color = Color.FromArgb(255,99,49);
SC[3].DefaultElement.Color = Color.FromArgb(0,156,255);
return SC;
}
void Page_Load(Object sender,EventArgs e)
{
// Set the title.
Chart.Title="My Chart";
// Set the x axis label
Chart.ChartArea.XAxis.Label.Text="X Axis Label";
// Set the y axis label
Chart.ChartArea.YAxis.Label.Text="Y Axis Label";
// Set the directory where the images will be stored.
Chart.TempDirectory="temp";
// Set the bar shading effect
Chart.ShadingEffect = true;
// Set he chart size.
Chart.Width = 600;
Chart.Height = 350;
// Add the random data.
Chart.SeriesCollection.Add(getRandomData());
}
</script>
<HTML><HEAD><TITLE>Gallery Sample</TITLE></HEAD>
<BODY>
<DIV align=center>
<dotnet:Chart id="Chart" runat="server"/>
</DIV>
</BODY>
</BODY>
</HTML>
vb.net
<%@ Page Language="VB" Description="dotnetCHARTING Component"%>
<%@ Register TagPrefix="dotnet" Namespace="dotnetCHARTING" Assembly="dotnetCHARTING"%>
<%@ Import Namespace="System.Drawing" %>
<script runat="server">
Function getRandomData() As SeriesCollection
Dim SC As New SeriesCollection()
Dim myR As New Random()
Dim a As Integer
For a = 0 To 3
Dim s As New Series()
s.Name = "Series " & a
Dim b As Integer
For b = 0 To 4
Dim e As New Element()
e.Name = "E " & b
e.YValue = myR.Next(50)
s.Elements.Add(e)
Next b
SC.Add(s)
Next a
SC(0).DefaultElement.Color = Color.FromArgb(49, 255, 49)
SC(1).DefaultElement.Color = Color.FromArgb(255, 255, 0)
SC(2).DefaultElement.Color = Color.FromArgb(255, 99, 49)
SC(3).DefaultElement.Color = Color.FromArgb(0, 156, 255)
Return SC
End Function 'getRandomData
Sub Page_Load(sender As [Object], e As EventArgs)
' Set the title.
Chart.Title = "My Chart"
' Set the x axis label
Chart.ChartArea.XAxis.Label.Text = "X Axis Label"
' Set the y axis label
Chart.ChartArea.YAxis.Label.Text = "Y Axis Label"
' Set the directory where the images will be stored.
Chart.TempDirectory = "temp"
' Set the bar shading effect
Chart.ShadingEffect = True
' Set he chart size.
Chart.Size = "600x350"
' Add the random data.
Chart.SeriesCollection.Add(getRandomData())
End Sub 'Page_Load
</script>
<HTML><HEAD><TITLE>Gallery Sample</TITLE></HEAD>
<BODY>
<DIV align=center>
<dotnet:Chart id="Chart" runat="server"/>
</DIV>
</BODY>
</BODY>
</HTML>
破解版下载地址:http://files.cnblogs.com/dreamof/dotnetcharting.rar
使用手册可从官方网下载(E文):http://www.dotnetcharting.com
标签: Program
- 扩展阅读
◎欢迎参与讨论,请在这里发表您的看法、交流您的观点。
Search
SEO专题
热门文章
- [06/07]win7管理模板“进行解析时遇到错误”的解决方法
- [11/24]Font Awesome图标在IE浏览器不显示的解决方法
- [11/22]Font Awesome content代码汇总,共246个
- [11/01]Apache设置浏览器缓存
- [06/07]zblog和dedecms FCKeditor编辑器IE11不显示的解决方法
- [09/30]360公共库关闭,fonts调用链接可改为googleapi的
- [09/29]启动防火墙后远程自动断开的处理方法
- [03/21]WordPress速度慢?瞬间提速3倍的方法
- [11/01]安装Apache选择8080端口,安装完毕启动Apache失败的原因
- [06/06]卡卡网站速度诊断新增移动设备打开诊断功能
最近发表
- [08/15]错误原因:没有权限,对象关闭时,不允许操作 ADODB.Connection
- [06/13]修改注册表解决:“正在启动windows”卡住进不去
- [02/08]SCSS编译为CSS最好用的在线工具
- [09/23]win2012 asp上传最大附件限制,只需这样设,不用关闭重启IIS
- [08/24]IIS6/IIS7/IIS7.5/IIS8.0/IIS10.0设置全站或目录禁止执行脚本
- [06/27]还要添加入站规则,windows2008/2012修改远程端口号
- [05/05]卡卡网Ping工具改版,新增丢包率(Loss)、抖动(Jitter)等功能
- [04/18]WebKaka卡卡网站测速改版,功能更强大,内容更丰富
- [04/07]卡卡网路由追踪(网页版)新增IP ASN信息
- [03/24]【详解】localhost 和 127.0.0.1 的区别
- [02/14]彻底屏蔽FF新鲜事弹窗
- [01/26]Firefox火狐浏览器自带截图工具:可以滚动网页选取截图区域
- [01/19]设置IIS7 http重定向到https【图文教程】
- [09/16]Win10 IIS 10.0 配置支持PHP详细教程
- [08/30]Font Awesome V5 1000个图标及对应编码【含库文件下载】
最新评论及回复
最近留言
网站分类
Powered By Z-Blog 1.8 Walle Build 91204 Designed by Han'space
Copyright @2009-2024 All Rights Reserved. 粤ICP备14028160号-1

Copyright @2009-2024 All Rights Reserved.
